How much weight should we put on the fact that the S&P 500 index powered above its 200-day moving average this week? If history is any indication, then this is actually a fairly momentous occasion. Unless it’s a repeat of March 2022, in which case we’re obviously poised for a push to new lows any minute now.
To be clear, any signal considered bullish or bearish is based on the average reaction back through the history of the financial markets. So, instead of a signal always being 100% bullish or 100% bearish, I tend to think in terms of tendencies. In short, we should ask ourselves, “What tends to happen after this signal has occurred?”
Today, we’ll dig into a brief history of the S&P 500 and its 200-day moving average.
The 200-Day as a Market Barometer
One of my mentors used to say, “Nothing good happens below the 200-day moving average.” To rephrase, it pays to be patient for a move above the 200-day moving average, because, until then, it’s at best a bear market rally.
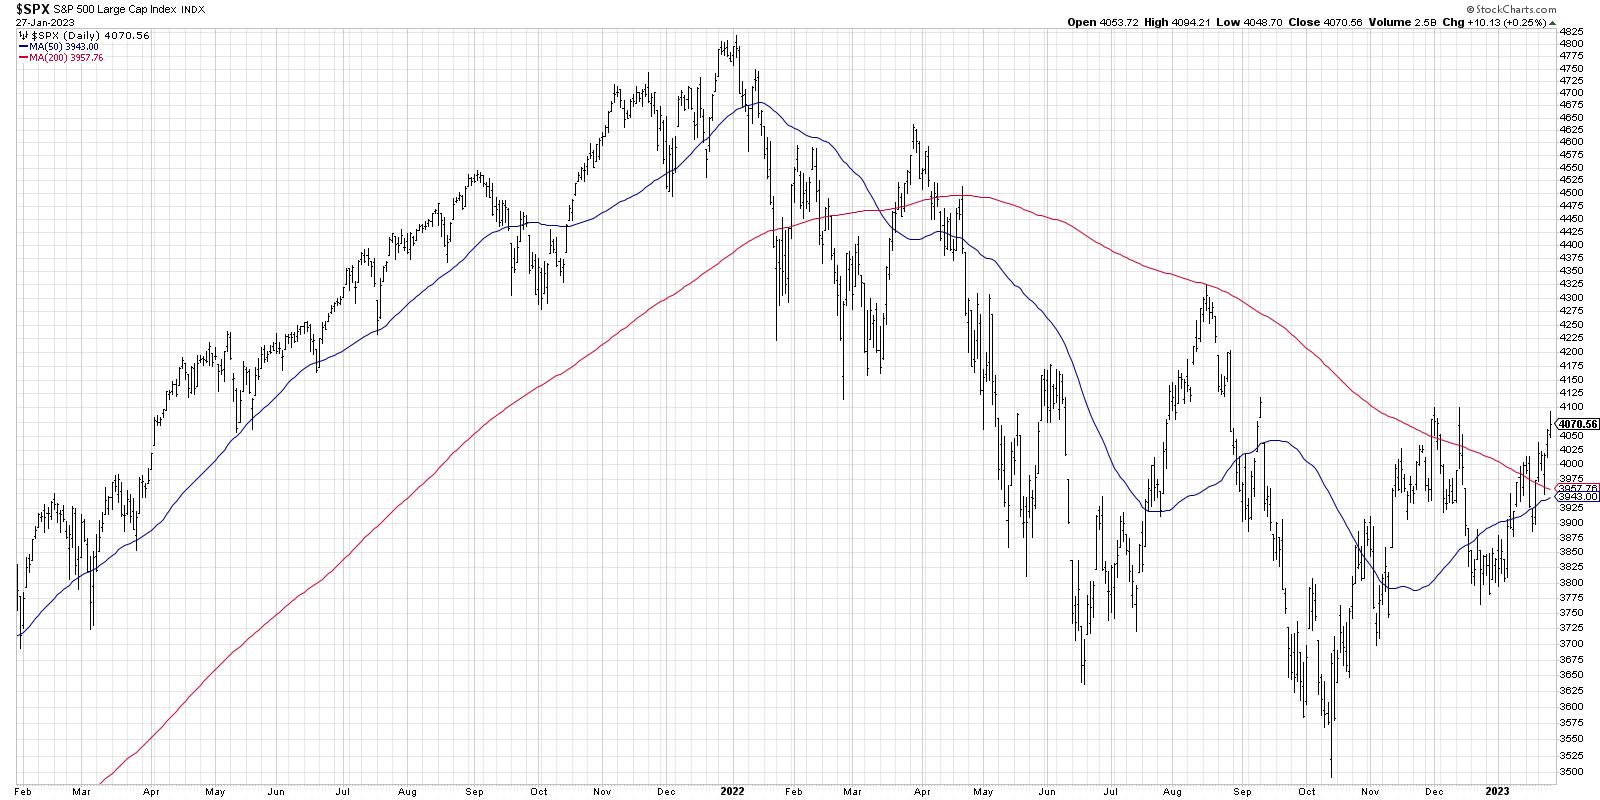
Way back in 2021 (actually not that long ago!), the SPX stayed well above its 200-day moving average. In fact, it often tested the 50-day moving average, and pretty much every one of those tests ended up being a decent buying opportunity.
In January 2022, when the S&P 500 broke below its 50-day and 200-day moving averages, it certainly suggested that something was different. This is the sort of “change of character” that I hope to identify in my daily and weekly market analysis routines. Attempts to break out above the 200-day in August and November 2022 failed to see any upside follow through. So, when I see the price break above this moving average earlier this month, then the subsequent followthrough with higher swing highs over the last five trading days, I have to consider that a bullish tell.
Going into next week, I’d love to see a confirmed break above the 4100 level, which, I believe, would open the way to a retest of the August 2022 high around 4300. But let’s continue our analysis of market history and consider some alternative approaches to the 200-day moving average.
The Moving Average Crossover Technique
While there is often plenty of noise produced when we achieve a “golden cross” or “death cross” on the major averages, I have found them to not be the most effective ways to determine uptrends and downtrends. However, while the timing may not be perfect on these signals, I would admit that the occurrence of a golden cross next week (which seems highly likely if we rally further around the Fed meeting) would confirm even more strength in equities off the October low.
You’ll notice on this chart that, when the 50-day moving average (blue) crosses above the 200-day (red), it’s often way after the bottom. And that makes sense for a trend-following indicator! The most recent buy signals were in July 2020 (well after the March low) and April 2019 (after a big rally off the December 2018 low).
So while waiting for the golden cross may not feel like the best timing signal ever created, the fact remains that, in a secular bull market phase (which we are arguably still in), these signals often lead to much stronger gains.
We could also strip out the 50-day moving average and just look at the slope of the 200-day moving average. On The Final Bar this week, my guest Willie Delwiche did a great job explaining why the slope of the 200-day can be an important data point.
You can easily see the relationship between the slope of the 200-day moving average (in purple on this chart) and the trend of highs and lows in the raw price data (in light gray). So when the 200-day has been sloping lower and then turns higher, this could be a better indication of an upside follow-through than some of the other techniques we’ve discussed.
Putting It All Together With Other Indicators
You have to remember, however, that moving averages don’t just happen in a vacuum. There are other indicators we can use to confirm or deny the signals we’re finding in a simple analysis of the moving average patterns.
Let’s add the PPO and RSI on the weekly S&P 500 chart and see how the current configuration relates to other market declines. Now that we’re using a weekly chart, I’m showing the 40-week moving average (similar to the 200-day moving average and shown in red) as well as the 150-week moving average in green.
If you look at 2022-2023 and compare it to 2015-2016 and 2007-2008, you’ll notice that these factors are all the same for the S&P 500 index:
A new all-time high, followed by a lower high and a failure to hold the 40-week moving average, which then turns lowerA retest of the 40-week moving average from below, then a break below the 150-week moving averageThe PPO gives a buy signal, followed soon after by another sell signalThe RSI shows a bullish momentum divergence
But then the patterns start to diverge a bit. In 2008, the S&P failed to get back above the 40-week moving average. There was no additional buy signal from the PPO, and the RSI plunged into the oversold territory as the SPX accelerated lower for the next six months.
In 2016, however, the S&P briefly dipped below the 150-week moving average before powering back above this long-term barometer. The index then moved above its 40-week moving average, the RSI pushed above 50, and the PPO generated a new buy signal.
Now look at the current configuration, and you’ll notice that it matches much more closely to 2016 than 2008. The conclusion? This may be just the beginning of a bullish recovery as positive momentum builds for stocks.
Want to digest this article in video format? You can find it over at my YouTube channel.
RR#6,
Dave
P.S. Ready to upgrade your investment process? Check out my YouTube channel!
David Keller, CMT
Chief Market Strategist
StockCharts.com
Disclaimer: This blog is for educational purposes only and should not be construed as financial advice. The ideas and strategies should never be used without first assessing your own personal and financial situation, or without consulting a financial professional.
The author does not have a position in mentioned securities at the time of publication. Any opinions expressed herein are solely those of the author and do not in any way represent the views or opinions of any other person or entity.