• Investing
  • Stock
Round Table Thoughts
  • Economy
  • Editor’s Pick
Home Stock Five Ways You Should Use ChartLists Starting Today!
Stock

Five Ways You Should Use ChartLists Starting Today!

by November 27, 2024
by November 27, 2024 0 comment
Share
0
FacebookTwitterPinterestWhatsapp

Having used many technical analysis platforms over my career as a technical analyst, I can tell you with a clear conscience that the ChartList feature on StockCharts provides exceptional capabilities to help you identify investment opportunities and manage risk in your portfolio.

Once you get your portfolio or watch list set up using the ChartList feature, you can use these five powerful tools to break down the list of stocks or ETFs, identify patterns of strength and weakness, and anticipate where the next opportunities may arise!

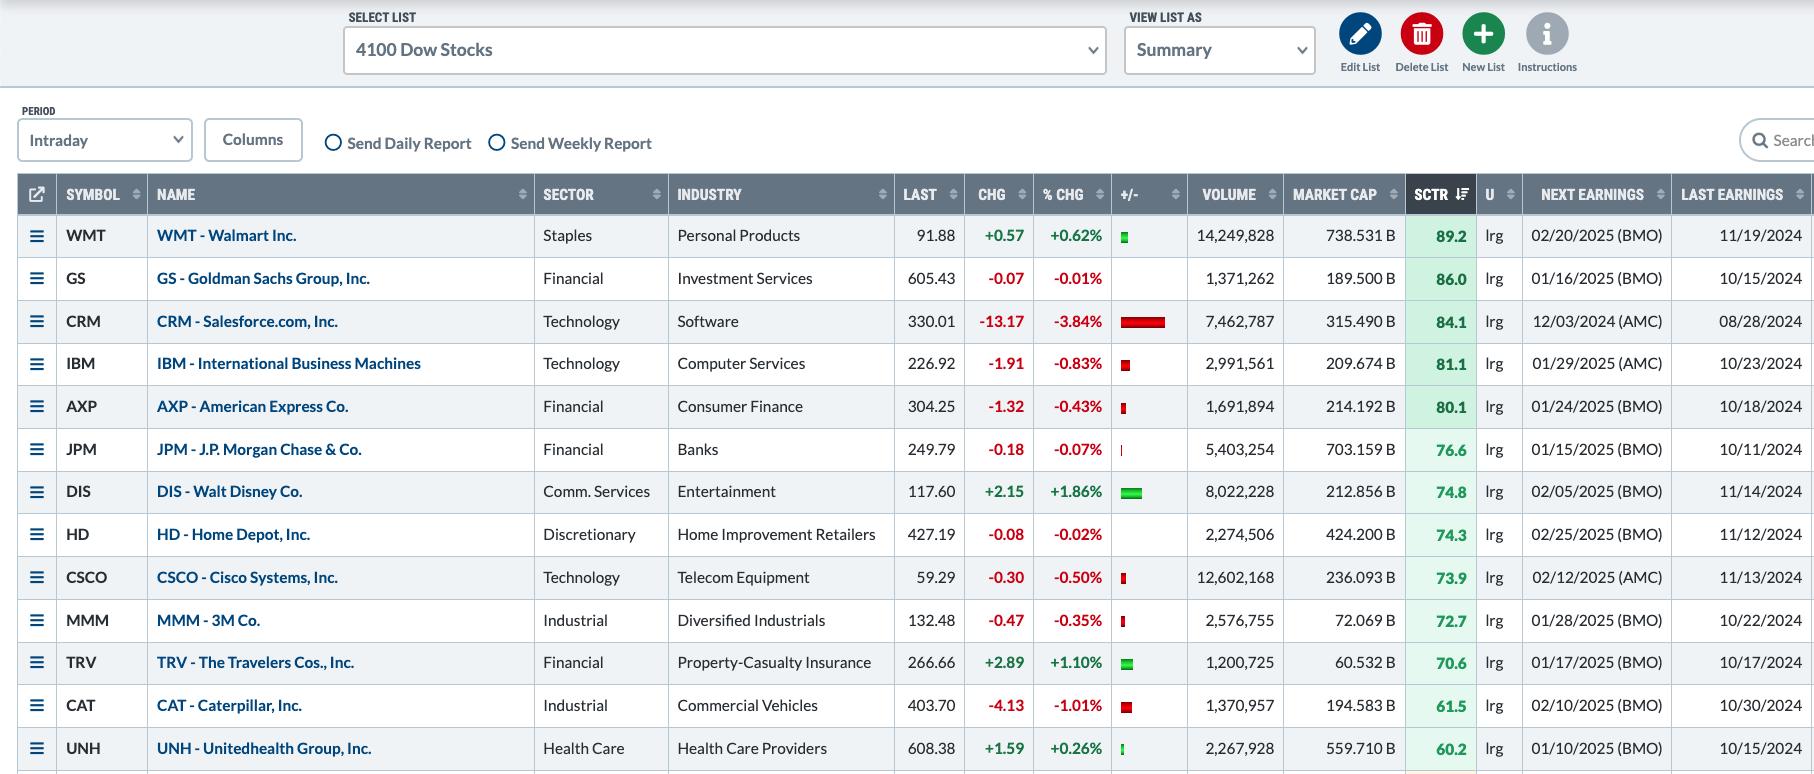
Summary View to Identify Outliers

The Summary view is a great starting point, sort of like a high level menu of what all we can do with this list of charts.  All of the columns are sortable, so we can begin to find patterns and relationships by grouping similar stocks by sector or sorting by market cap.

One of my favorite things to do right off the bat is sort by “Next Earnings Date”.  Whether you’re a long-term investor or a swing trader or somewhere in between, you always want to know when earnings could create a sudden move in either direction!

ChartList View to Analyze Technical Patterns

Once I’ve made some general assessments about the stocks on my list using the Summary View, I like to use the ChartList view to review each chart, one by one.  This view uses the alphabetical order of the titles of your charts, so make sure to add numbers before the tickers if you prefer a particular order.

Especially when I’m reviewing a longer list of tickers, I’ll use the ChartList view to go through a bunch of charts, jotting down tickers on my notepad for further review later in the day.  It’s easy to switch all of the charts to a different ChartStyle, which comes in handy if you want to switch to weekly or monthly charts, for example.  Just select one of the charts, change the ChartStyle, then look for a link called “Apply ChartStyle to All” at the bottom!

CandleGlance View to Separate Into Buckets

When I worked at a large financial institution in Boston, I would print out a bunch of charts representing a particular fund’s holdings, then spread the charts out on a conference table.  I’d look for similar patterns and structures, and start to separate the charts into bullish, bearish, and neutral piles.  From there, I could focus my attention on the most actionable charts.

The CandleGlance view provides this capability without having to print out all of those charts!  We can easily detect similar patterns and signals, helping me spend my time on the most actionable charts within a larger list.  I can’t tell you how much time this one feature has saved me in terms of efficiently breaking down a list of charts!  Don’t forget that you can customize the ChartStyle you use for this view, allowing you to apply your own proprietary charting approach to this visualization.

Performance View to Focus on Consistent Winners

What if you just want to analyze the performance of a group of stocks or ETFs, to better understand which charts have been the most and least profitable over a period of time?  The Performance View shows a series of time frames in tabular format, allowing you to focus on top and bottom periods over multiple time frames.

This can be a fantastic way to break down your portfolio, helping you better understand which positions have been helping your performance, and which ones may actually have been holding you back!

Correlation View to Understand Price Relationships

Finally, we come to one of the most underutilized features of ChartLists, and that’s the Correlation View.  This can help better define the relationship between two different data series, and identify which stocks or ETFs could help us diversify our portfolio.

I like to sort this view in ascending order based on the 20-day correlation as a starting point.  Which stocks demonstrated a very different return profile from the S&P 500?  When it feels as if all stocks are doing about the same thing, this one feature can help you quickly identify outliers and positions which could help you improve your performance through diversification.

I’ve found the ChartList capabilities to be some of the most powerful features on the StockCharts platform.  Once you get into the habit of using these incredible list management and analytical tools, I hope you’ll enjoy a greater amount of market awareness in your life!

RR#6,

Dave

PS- Ready to upgrade your investment process?  Check out my free behavioral investing course!

David Keller, CMT

President and Chief Strategist

Sierra Alpha Research LLC

Disclaimer: This blog is for educational purposes only and should not be construed as financial advice.  The ideas and strategies should never be used without first assessing your own personal and financial situation, or without consulting a financial professional.  

The author does not have a position in mentioned securities at the time of publication.    Any opinions expressed herein are solely those of the author and do not in any way represent the views or opinions of any other person or entity.

You Might Also Like
  • What Does This Mean for the S&P 500 Rally?
  • Why the Market is Ready to Rally!
  • The Ord Oracle October 3, 2023
  • Never Short a Dull Market; AI is Sexy, But Everyone Hates Oil
Share
0
FacebookTwitterPinterestWhatsapp

previous post
Navigating Holiday Stock Market Changes: Turn Sentiment Shifts into Successes
next post
Reddit targets international users for ad growth, teases bolstered search feature

You may also like

Optimizing Your Stock Selection With the Williams True Seasonal Indicator

September 8, 2023

Two Key Groups Take a Turn for the Worse

September 19, 2023

The Stock Market’s Tremendous Resilience: What This Means For Q2

April 4, 2024

Week Ahead: NIFTY Stays Tentative As Defensive Setup Develops; Know...

August 10, 2024

Is the S&P 500 In Late Stage Accumulation?

February 4, 2023

Be ALERT for Warning Signs – S&P 500 Downturn

November 20, 2024

DecisionPoint Trading Room: Narrow Advance a Big Problem!

February 5, 2024

A Closer Look at Long Bonds and The US Dollar

October 10, 2023

Watch for These ADX Combinations

January 19, 2023

Top Five Charts of 2023 #5: Bitcoin

December 22, 2023

    Stay updated with the latest news, exclusive offers, and special promotions. Sign up now and be the first to know! As a member, you'll receive curated content, insider tips, and invitations to exclusive events. Don't miss out on being part of something special.


    By opting in you agree to receive emails from us and our affiliates. Your information is secure and your privacy is protected.

    Recent Posts

    • Three Sectors Stand Out and One Sports a Bullish Breakout

      June 13, 2025
    • RRG Update: Is Tech Ready to Break Out?

      June 13, 2025
    • What the S&P 500, VIX, and ARKK are Telling Us Now

      June 12, 2025
    • Howard Schultz says he ‘did a cartwheel’ when Starbucks CEO Niccol coined ‘back to Starbucks’ strategy

      June 12, 2025
    • U.S. online stores put up ‘out of stock’ signs as Nintendo Switch 2 sales hit record highs

      June 12, 2025

    Popular Posts

    • 1

      Trump-era China sanctions ended by Biden may be...

      June 27, 2024 2,849 views
    • 2

      Walz’s honeymoon with China gets fresh scrutiny as...

      August 9, 2024 2,552 views
    • 3

      Biden appointee played key role in recruiting Chinese...

      June 25, 2024 2,535 views
    • 4

      Shein’s global ambitions leaves some cybersecurity experts fearful...

      July 10, 2024 2,517 views
    • 5

      Harris VP pick spent years promoting research facility...

      August 29, 2024 2,393 views

    Categories

    • Economy (7,009)
    • Editor's Pick (2,129)
    • Investing (538)
    • Stock (2,608)

    Popular Posts

    • 1

      Trump-era China sanctions ended by Biden may be revived under new House GOP bill

      June 27, 2024
    • 2

      Walz’s honeymoon with China gets fresh scrutiny as Harris camp blasts ‘lying’ critics

      August 9, 2024
    • 3

      Biden appointee played key role in recruiting Chinese businesses to Delaware: ‘Longtime friends’

      June 25, 2024
    • 4

      Shein’s global ambitions leaves some cybersecurity experts fearful of Chinese spy threats

      July 10, 2024
    • 5

      Harris VP pick spent years promoting research facility that collaborated with ‘Chinese military company’

      August 29, 2024

    Latest News

    • Three Sectors Stand Out and One Sports a Bullish Breakout

      June 13, 2025
    • RRG Update: Is Tech Ready to Break Out?

      June 13, 2025
    • What the S&P 500, VIX, and ARKK are Telling Us...

      June 12, 2025

    Categories

    • Economy (7,009)
    • Editor's Pick (2,129)
    • Investing (538)
    • Stock (2,608)

    Disclaimer: RoundTableThoughts.com, its managers, its employees, and assigns (collectively “The Company”) do not make any guarantee or warranty about what is advertised above. Information provided by this website is for research purposes only and should not be considered as personalized financial advice. The Company is not affiliated with, nor does it receive compensation from, any specific security. The Company is not registered or licensed by any governing body in any jurisdiction to give investing advice or provide investment recommendation. Any investments recommended here should be taken into consideration only after consulting with your investment advisor and after reviewing the prospectus or financial statements of the company.

    Copyright © 2024 RoundTableThoughts.com. All Rights Reserved.

    Round Table Thoughts
    • Investing
    • Stock
    Round Table Thoughts
    • Economy
    • Editor’s Pick

    Read alsox

    The Market’s Contagious Buzz: What About...

    March 23, 2023

    The Best Form of MACD Divergence

    March 30, 2023

    This MUST SEE MACD Pattern is...

    May 29, 2024
    Sign In

    Keep me signed in until I sign out

    Forgot your password?

    Password Recovery

    A new password will be emailed to you.

    Have received a new password? Login here